SCTI-RSKSCTI-RSK 是一个多功能技术指标合集,整合了多种常用技术指标于一个图表中,方便交易者综合分析市场状况。该指标包含以下五个主要技术指标模块,每个模块都可以单独显示或隐藏:
Stoch RSI - 随机相对强弱指数
KDJ - 随机指标
RSI - 相对强弱指数
CCI - 商品通道指数
Williams %R - 威廉指标
主要特点
模块化设计:每个指标都可以单独开启或关闭显示
交叉信号可视化:Stoch RSI和KDJ的金叉/死叉信号有彩色填充标识
多时间框架分析:支持不同长度的参数设置
直观界面:清晰的参数分组和颜色区分
适用场景
趋势判断
超买超卖区域识别
交易信号确认
多指标共振分析
English Description
SCTI-RSK is a comprehensive technical indicator that combines multiple popular indicators into a single chart for traders to analyze market conditions holistically. The indicator includes the following five main technical indicator modules, each can be toggled on/off individually:
Stoch RSI - Stochastic Relative Strength Index
KDJ - Stochastic Oscillator
RSI - Relative Strength Index
CCI - Commodity Channel Index
Williams %R - Williams Percent Range
Key Features
Modular Design: Each indicator can be shown or hidden independently
Visual Crossover Signals: Golden/Death crosses are highlighted with color fills for Stoch RSI and KDJ
Multi-Timeframe Analysis: Supports different length parameters
Intuitive Interface: Clear parameter grouping and color differentiation
Use Cases
Trend identification
Overbought/Oversold zone recognition
Trade signal confirmation
Multi-indicator confluence analysis
参数说明 (Parameter Explanation)
指标参数分为6个主要组别:
基础指标设置 - 控制各指标的显示/隐藏
Stoch RSI 设置 - 包括K值、D值、RSI长度等参数
KDJ 设置 - 包括周期、信号线等参数
RSI 设置 - 包括RSI长度、中期长度等参数
CCI 设置 - 包括CCI长度、中期长度等参数
Williams %R 设置 - 包括长度参数
使用建议 (Usage Suggestions)
初次使用时,可以先开启所有指标观察它们的相互关系
根据个人交易风格调整各指标的长度参数
关注多指标同时发出信号时的交易机会
结合价格行为和其他分析工具确认信号
更新日志 (Changelog)
v1.0 初始版本,整合五大技术指标
Cerca negli script per "STOCH RSI"

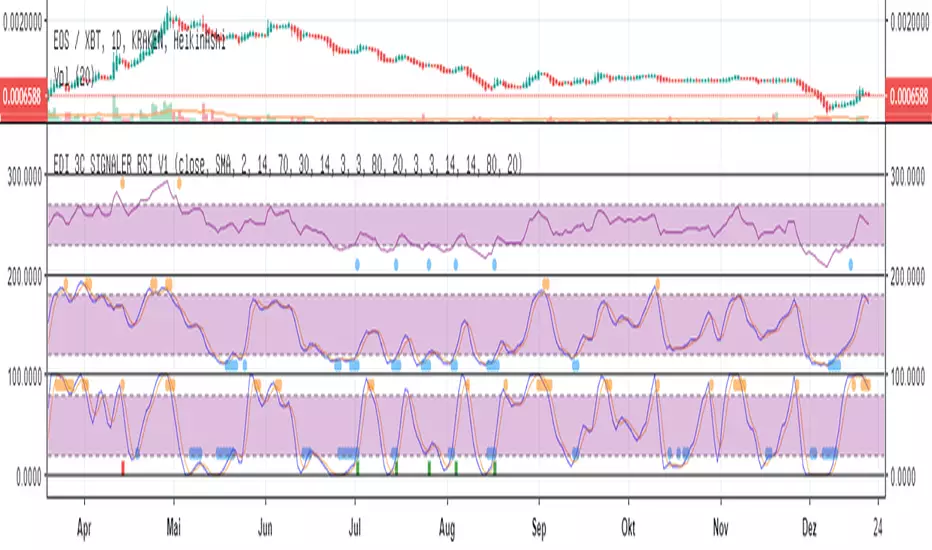
Eds Bot Signaler on Basis of RSI Stoch StochRSIEDS AWESOME BOT SIGNALER
Specially for use with e.g. 3commas or autoview
But can also be used just in normal manual (visual) mode
This Script is very early Beta. Works for visual manual use....
and also for 3Commas Bot as "Signaler" (how to connect with Bot, see the docu on 3commas).
... but can use as Signaler for any Bot who is able to get Tradingview sms-mails. (e.g. autoview)
It combines RSI, Stoch and Stoch-RSI.
You can choose normal RSI, or " returning RSI " (signals when leaving the sell/buy-zone. much higher profits with this)
You can choose how many of the indicators are needed to "fire".
You can choose if one of the indicators is a "must"
For Stoch & Stoch-RSI you can Choose sma or ema calculations of the moving average.
All the Values speak for themselves, if you are used to technical analyses (stay away in the moment, if you dont know, what rsi, stoch etc is used.
The Signals are also shown in the chart, the single ones, but also the combined which fires the Bot-Signal (shown as green and red column-candle at bottom)
Enjoy !! Free use in the moment.
More detailled Explanation in the future. Just play around!
If you wanna give something back:
BTC: 15buigKjh4JYnuVwcEWiYMpYvP3Lbp4ypL
Multi Oscillator OB/OS Signals v3 - Scope TestIndicator Description: Multi Oscillator OB/OS Signals
Purpose:
The "Multi Oscillator OB/OS Signals" indicator is a TradingView tool designed to help traders identify potential market extremes and momentum shifts by monitoring four popular oscillators simultaneously: RSI, Stochastic RSI, CCI, and MACD. Instead of displaying these oscillators in separate panes, this indicator plots distinct visual symbols directly onto the main price chart whenever specific predefined conditions (typically related to overbought/oversold levels or line crossovers) are met for each oscillator. This provides a consolidated view of potential signals from these different technical tools.
How It Works:
The indicator calculates the values for each of the four oscillators based on user-defined settings (like length periods and price sources) and then checks for specific signal conditions on every bar:
Relative Strength Index (RSI):
It monitors the standard RSI value.
When the RSI crosses above the user-defined Overbought (OB) level (e.g., 70), it plots an "Overbought" symbol (like a downward triangle) above that price bar.
When the RSI crosses below the user-defined Oversold (OS) level (e.g., 30), it plots an "Oversold" symbol (like an upward triangle) below that price bar.
Stochastic RSI:
This works similarly to RSI but is based on the Stochastic calculation applied to the RSI value itself (specifically, the %K line of the Stoch RSI).
When the Stoch RSI's %K line crosses above its Overbought level (e.g., 80), it plots its designated OB symbol (like a downward arrow) above the bar.
When the %K line crosses below its Oversold level (e.g., 20), it plots its OS symbol (like an upward arrow) below the bar.
Commodity Channel Index (CCI):
It tracks the CCI value.
When the CCI crosses above its Overbought level (e.g., +100), it plots its OB symbol (like a square) above the bar.
When the CCI crosses below its Oversold level (e.g., -100), it plots its OS symbol (like a square) below the bar.
Moving Average Convergence Divergence (MACD):
Unlike the others, MACD signals here are not based on fixed OB/OS levels.
It identifies when the main MACD line crosses above its Signal line. This is considered a bullish crossover and is indicated by a specific symbol (like an upward label) plotted below the price bar.
It also identifies when the MACD line crosses below its Signal line. This is a bearish crossover, indicated by a different symbol (like a downward label) plotted above the price bar.
Visualization:
All these signals appear as small, distinct shapes directly on the price chart at the bar where the condition occurred. The shapes, their colors, and their position (above or below the bar) are predefined for each signal type to allow for quick visual identification. Note: In the current version of the underlying code, the size of these shapes is fixed (e.g., tiny) and not user-adjustable via the settings.
Configuration:
Users can access the indicator's settings to customize:
The calculation parameters (Length periods, smoothing, price source) for each individual oscillator (RSI, Stoch RSI, CCI, MACD).
The specific Overbought and Oversold threshold levels for RSI, Stoch RSI, and CCI.
The colors associated with each type of signal (OB, OS, Bullish Cross, Bearish Cross).
(Limitation Note: While settings exist to toggle the visibility of signals for each oscillator individually, due to a technical workaround in the current code, these toggles may not actively prevent the shapes from plotting if the underlying condition is met.)
Alerts:
The indicator itself does not automatically generate pop-up alerts. However, it creates the necessary "Alert Conditions" within TradingView's alert system. This means users can manually set up alerts for any of the specific signals generated by the indicator (e.g., "RSI Overbought Enter," "MACD Bullish Crossover"). When creating an alert, the user selects this indicator, chooses the desired condition from the list provided by the script, and configures the alert actions.
Intended Use:
This indicator aims to provide traders with convenient visual cues for potential over-extension in price (via OB/OS signals) or shifts in momentum (via MACD crossovers) based on multiple standard oscillators. These signals are often used as potential indicators for:
Identifying areas where a trend might be exhausted and prone to a pullback or reversal.
Confirming signals generated by other analysis methods or trading strategies.
Noting shifts in short-term momentum.
Disclaimer: As with any technical indicator, the signals generated should not be taken as direct buy or sell recommendations. They are best used in conjunction with other forms of analysis (price action, trend analysis, volume, fundamental analysis, etc.) and within the framework of a well-defined trading plan that includes risk management. Market conditions can change, and indicator signals can sometimes be false or misleading.

UFO + Realtime Divergences (UO x MFI)UFO + Realtime Divergences (UO x MFI) + Alerts
The UFO is a hybrid of two powerful oscillators - the Ultimate Oscillator (UO) and the Money Flow Index (MFI)
Features of the UFO include:
- Optional divergence lines drawn directly onto the oscillator in realtime.
- Configurable alerts to notify you when divergences occur, as well as centerline crossovers.
- Configurable lookback periods to fine tune the divergences drawn in order to suit different trading styles and timeframes.
- Background colouring option to indicate when the oscillator has crossed its centerline.
- Alternate timeframe feature allows you to configure the oscillator to use data from a different timeframe than the chart it is loaded on.
- 2x MTF triple-timeframe Stochastic RSI overbought and oversold confluence signals painted at the top of the panel for use as a confluence for reversal entry trades.
The core calculations of the UFO+ combine the factory settings of the Ultimate Oscillator and Money Flow Index, taking an average of their combined values for its output eg:
UO_Value + MFI_Value / 2
The result is a powerful oscillator capable of detecting high quality divergences, including on very low timeframes and highly volatile markets, it benefits from the higher weighting of the most recent price action provided by the Ultimate Oscillators calculations, as well as the calculation of the MFI, which incorporates volume data. The UFO and its incorporated 2x triple-timeframe MTF Stoch RSI overbought and oversold signals makes it well adapted for low timeframe scalping and regular divergence trades in particular.
The Ultimate Oscillator (UO)
Tradingview describes the Ultimate Oscillator as follows:
“The Ultimate Oscillator indicator (UO) is a technical analysis tool used to measure momentum across three varying timeframes. The problem with many momentum oscillators is that after a rapid advance or decline in price, they can form false divergence trading signals. For example, after a rapid rise in price, a bearish divergence signal may present itself, however price continues to rise. The Ultimate Oscillator attempts to correct this by using multiple timeframes in its calculation as opposed to just one timeframe which is what is used in most other momentum oscillators.”
You can read more about the UO and its calculations here
The Money Flow Index ( MFI )
Investopedia describes the True Strength Indicator as follows:
“The Money Flow Index ( MFI ) is a technical oscillator that uses price and volume data for identifying overbought or oversold signals in an asset. It can also be used to spot divergences which warn of a trend change in price. The oscillator moves between 0 and 100. Unlike conventional oscillators such as the Relative Strength Index ( RSI ), the Money Flow Index incorporates both price and volume data, as opposed to just price. For this reason, some analysts call MFI the volume-weighted RSI .”
You can read more about the MFI and its calculations here
The Stochastic RSI (relating to the built-in MTF Stoch RSI feature)
The popular oscillator has been described as follows:
“The Stochastic RSI is an indicator used in technical analysis that ranges between zero and one (or zero and 100 on some charting platforms) and is created by applying the Stochastic oscillator formula to a set of relative strength index ( RSI ) values rather than to standard price data. Using RSI values within the Stochastic formula gives traders an idea of whether the current RSI value is overbought or oversold. The Stochastic RSI oscillator was developed to take advantage of both momentum indicators in order to create a more sensitive indicator that is attuned to a specific security's historical performance rather than a generalized analysis of price change.”
You can read more about the Stochastic RSI and its calculations here
How do traders use overbought and oversold levels in their trading?
The oversold level, that is when the Stochastic RSI is above the 80 level is typically interpreted as being 'overbought', and below the 20 level is typically considered 'oversold'. Traders will often use the Stochastic RSI at an overbought level as a confluence for entry into a short position, and the Stochastic RSI at an oversold level as a confluence for an entry into a long position. These levels do not mean that price will necessarily reverse at those levels in a reliable way, however. This is why this version of the Stoch RSI employs the triple timeframe overbought and oversold confluence, in an attempt to add a more confluence and reliability to this usage of the Stoch RSI .
What are divergences?
Divergence is when the price of an asset is moving in the opposite direction of a technical indicator, such as an oscillator, or is moving contrary to other data. Divergence warns that the current price trend may be weakening, and in some cases may lead to the price changing direction.
There are 4 main types of divergence, which are split into 2 categories;
regular divergences and hidden divergences. Regular divergences indicate possible trend reversals, and hidden divergences indicate possible trend continuation.
Regular bullish divergence: An indication of a potential trend reversal, from the current downtrend, to an uptrend.
Regular bearish divergence: An indication of a potential trend reversal, from the current uptrend, to a downtrend.
Hidden bullish divergence: An indication of a potential uptrend continuation.
Hidden bearish divergence: An indication of a potential downtrend continuation.
How do traders use divergences in their trading?
A divergence is considered a leading indicator in technical analysis , meaning it has the ability to indicate a potential price move in the short term future.
Hidden bullish and hidden bearish divergences, which indicate a potential continuation of the current trend are sometimes considered a good place for traders to begin, since trend continuation occurs more frequently than reversals, or trend changes.
When trading regular bullish divergences and regular bearish divergences, which are indications of a trend reversal, the probability of it doing so may increase when these occur at a strong support or resistance level . A common mistake new traders make is to get into a regular divergence trade too early, assuming it will immediately reverse, but these can continue to form for some time before the trend eventually changes, by using forms of support or resistance as an added confluence, such as when price reaches a moving average, the success rate when trading these patterns may increase.
Typically, traders will manually draw lines across the swing highs and swing lows of both the price chart and the oscillator to see whether they appear to present a divergence, this indicator will draw them for you, quickly and clearly, and can notify you when they occur.
Setting alerts.
With this indicator you can set alerts to notify you when any/all of the above types of divergences occur, on any chart timeframe you choose.
Configurable pivot period.
You can adjust the default pivot lookback values to suit your prefered trading style and timeframe. If you like to trade a shorter time frame, lowering the default lookback values will make the divergences drawn more sensitive to short term price action.
Disclaimer: This script includes code from the stock UO and MFI by Tradingview as well as the Divergence for Many Indicators v4 by LonesomeTheBlue.

[@btc_charlie] Trader XO Macro Trend ScannerWhat is this script?
This script has two main functions focusing on EMAs (Exponential Moving Average) and Stochastic RSI.
EMAs
EMAs are typically used to give a view of bullish / bearish momentum. When the shorter EMA (calculated off more recent price action) crosses, or is above, the slower moving EMA (calculated off a longer period of price action), it suggests that the market is in an uptrend. This can be an indication to either go long on said asset, or that it is more preferable to take long setups over short setups. Invalidation on long setups is usually found via price action (e.g. previous lows) or simply waiting for an EMA cross in the opposite direction (i.e. shorter EMA crosses under longer term EMA).
This is not a perfect system for trade entry or exit, but it does give a good indication of market trends. The settings for the EMAs can be changed based on user inputs, and by default the candles are coloured based on the crosses to make it more visual. The default settings are based on “Trader XO’s” settings who is an exceptional swing trader.
RSI
Stochastic RSI is a separate indicator that has been added to this script. RSI measures Relative Strength (RSI = Relative Strength Index). When RSI is <20 it is considered oversold, and when >80 it is overbought. These conditions suggests that momentum is very strong in the direction of the trend.
If there is a divergence between the price (e.g. price is creating higher highs, and stoch RSI is creating lower highs) it suggests the strength of the trend is weakening. Whilst this script does not highlight divergences, what it does highlight is when the shorter term RSI (K) crosses over D (the average of last 3 periods). This can give an indication that the trend is losing strength.
Combination
The EMAs indicate when trend shifts (bullish or bearish).
The RSI indicates when the trend is losing momentum.
The combination of the two can be used to suggest when to prefer a directional bias, and subsequently shift in anticipation of a trend reversal.
Note that no signal is 100% accurate and an interpretation of market conditions and price action will need to be overlayed to
Why is it different to others?
I have not found other scripts that are available in this way visually including alerts when Stoch RSI crosses over/under the extremes; or the mid points.
Whilst these indicators are default, the combination of them and how they are presented is not and makes use of the TradingView colouring functionalities.
What are the features?
Customise the variables (averages) used in the script.
Display as one EMA or two EMAs (the crossing ones).
Alerts on EMA crosses.
Alerts on Stoch RSI crosses - slow/fast, upper, lower areas.
- Currently set on the chart to show alerts when Stoch RSI is above 80, then falls below 80 (and colours it red).
Customisable colours.
What are the best conditions for this?
It is designed for high timeframe charts and analysis in crypto, since crypto tends to trend.
It can however be used for lower timeframes.
Disclaimer/Notes:
I have noticed several videos appearing suggesting that this is a "100% win rate indicator" .
NO indicator has 100% win rate.
An indicator is an *indicator* that is all.
Please use responsibly and let me know if there are any mods or updates you would like to see.

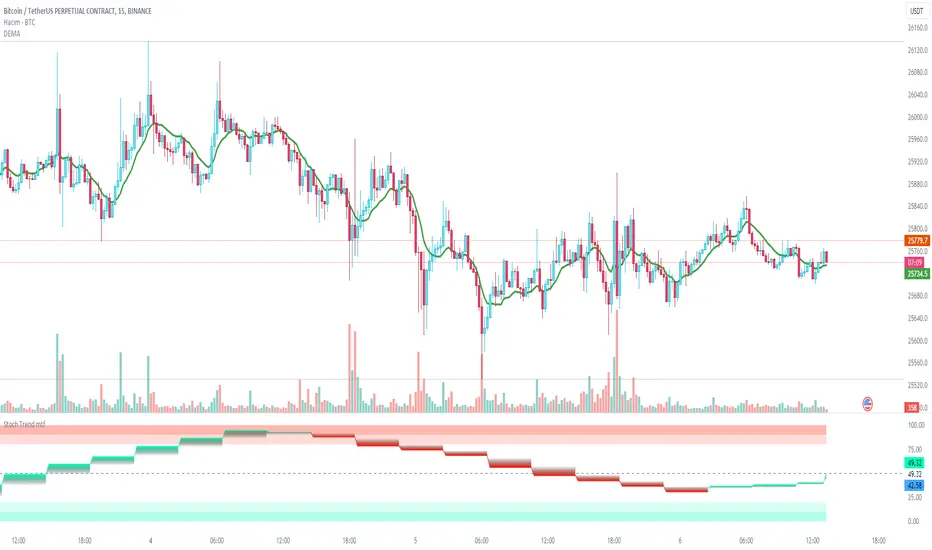
Stochastic Trend mtfDefinition
The Stochastic RSI indicator (Stoch RSI) is actually an indicator of an indicator. It is used in technical analysis to provide a stochastic calculation to the RSI indicator. This means it's an RSI measure relative to its own high/low range over a user-defined time period. Stochastic RSI is an oscillator that calculates a value between 0 and 1 and then plots it as a line. This indicator is primarily used to identify overbought and oversold conditions.
It is important to remember that the Stoch RSI is an indicator of an indicator that is two steps away from the price. The RSI is one step away from the price and therefore a stochastic calculation of the RSI is two steps away. This is important because as with any indicator that is more than one step away from price, the Stoch RSI can be short-term disconnected from actual price action. However, as a range-bound indicator, the Stoch RSI's primary function is to identify cross-bought, overbought and oversold conditions.
Use
When we integrate it into our chart in the upper time frame, it both gives the direction of the trend more healthy and is more efficient in terms of noise reduction in terms of leaving the overbought-sold zones. Unlike the classic stochastic, I set the "d" value to 8. Even though the trend returns are a little late, we see healthier data on our graph. Trend changes in overbought zones are getting stronger. Coloring red indicates that the trend is selling, while painting green indicates that the trend is buying. I hope you find it useful, if you have any questions or suggestions, please feel free to ask.
Good luck...
It is not investment advice.
The WWG Plan Indicator V2█ OVERALL
This indicator was specifically created for the Walsh Wealth Group.
In short it is a fusion of some of the most basic and widely used indicators to show overbought patterns and trend reversals.
Its best usage is with LTF scalping and agressive profit taking but can also be used to find HTF dips and buy-zones.
█ FEATURES
Buy Signal (Buy):
Printed only with all confirmations triggered
Small Buy Signal (B1 & B2)
Printed if some of the confirmations are triggered and can be treated as DCA entries or for further
confirmation with other indicators and basic TA.
Crayons (Color Bars):
Blue: RSI is oversold
Olive: RSI and Stoch RSI are oversold
Yellow: RSI, Stoch RSI are oversold and lower Bollinger Bands are crossed by Low
Orange: RSI, Stoch RSI and CCI are oversold
Trailing SL:
If activated in the config, a trailing SL can be displayed on the chart based on ATR.
█ SETTINGS
The underlying indicators used are RSI, Stoch RSI, Bollinger Bands, MACD and CCI.
All possible configs can be changed in the config settings.
█ GENERAL INFORMATION
Depending on the settings, the indicator performance will be highly affected.
This indicator is only displaying highly oversold areas and events of trend reversal it is not a *God*-Signal and will print false positives.
█ ALERTS
An alert for the main buy-signal is implemented and can be used via the TV alert functionality.

Stochastic SuperTrend [BigBeluga]🔵 OVERVIEW
A hybrid momentum-trend tool that combines Stochastic RSI with SuperTrend logic to deliver clean directional signals based on momentum turns.
Stochastic SuperTrend is a straightforward yet powerful oscillator overlay designed to highlight turning points in momentum with high clarity. It overlays a SuperTrend-style envelope onto the Stochastic RSI, generating intuitive up/down signals when a momentum shift occurs across the neutral 50 level. Built for traders who appreciate simplicity without sacrificing reliability.
🔵 CONCEPTS
Stochastic RSI: Measures momentum by applying stochastic calculations to the RSI curve instead of raw price.
SuperTrend Bands: Dynamic upper/lower bands are drawn around the smoothed Stoch RSI line using a user-defined multiplier.
Momentum Direction: Trend flips when the smoothed Stoch RSI crosses above/below the calculated bands.
Neutral Bias Filter: Directional arrows only appear when momentum turns above or below the central 50 level—adding confluence.
🔵 FEATURES
Trend Detection on Oscillator: Applies SuperTrend logic directly to the Stoch RSI curve.
Clean Entry Signals:
→ 🢁 arrow printed when trend flips bullish below 50 (bottom reversals).
→ 🢃 arrow printed when trend flips bearish above 50 (top reversals).
Custom Multiplier: Adjust sensitivity of SuperTrend band spacing around the oscillator.
Neutral Zone Highlight: Visual zone between 0–50 (green) and 50–100 (red) for quick momentum polarity reference.
Toggle SuperTrend Line: Option to show/hide the SuperTrend trail on the Stoch RSI.
🔵 HOW TO USE
Use 🢁 signals for potential bottom reversals when momentum flips bullish from oversold regions.
Use 🢃 signals for potential top reversals when momentum flips bearish from overbought areas.
Combine with price-based SuperTrend or support/resistance zones for confluence.
Suitable for scalping, swing trading, or momentum filtering across all timeframes.
🔵 CONCLUSION
Stochastic SuperTrend is a simple yet refined tool that captures clean momentum shifts with directional clarity. Whether you're identifying reversals, filtering entries, or spotting exhaustion in a trend, this oscillator overlay delivers just what you need— no clutter, just clean momentum structure.

3x SuperTrend Strategy (Mel0nTek) V1This is a triple SuperTrend based strategy for lower time frame trades such as day trades and scalping. I have not seen many strategies that combine multiple SuperTrends so I thought I would publish this one since I put it together and have been quite happy with the results. I have found through testing that the best results are on currency exchange markets such as Crypto or Forex on 1-15 min time frames.
The core idea was inspired by a youtube video put out by Trade Pro:
"Trade Pro - HIGHEST PROFIT Triple Supertrend Trading Strategy Proven 100 Trade Results"
I went ahead and set the defaults to the ones he uses in his video for anyone who wants to try a configuration similar to his. They work pretty well in general, however the EMA, SuperTrend ATR multipliers, and P/L ratio can be tuned/optimized to fit the timeframe/market desired. The video is quite good but not a required watch as I will explain below.
The 200EMA is used as a medium-term trend direction indicator.
- Price closing consistently above the 200EMA means that only long positions should be entered.
- Price closing consistently below 200EMA means that only short positions should be entered.
The 3 SuperTrend indicators should be used as direction confirmation for entries. Typically, price above SuperTrend indicates bullish movement, while price below SuperTrend indicates Bearish movement. However by itself, it is not a great indication to enter/exit positions in my experience. By combining 3 of them with slightly longer periods and increased ATR multipliers, we can get much stronger confirmation of trend direction/strength.
The way they are used in this strategy is such that:
- We only want to enter a position if at least 2 out of 3 SuperTrends are on our side.
- 3/3 SuperTrends on our side is the best case, since we are taking trades WITH momentum/price strength.
- The second farthest SuperTrend from entry price is used as a Stop Loss
SuperTrend being on our side is not the only requirement for an entry however. The probability of success is increased with SuperTrend, and a longer EMA on our side, but we want to be sure that we aren't getting in too late/after the movement has already happened.
So we use Stoch RSI to pick our entries where price is oversold/overbought and reversing. That means the Stoch RSI is above 80, or below 20, and our indication to enter the trade is when the 2 lines cross/begin reversing direction.
So with trend direction on our side, we can get really good entries at these oversold/overbought extremes, especially as it's reversing (Stoch RSI K and D are crossing). This allows us to use the SuperTrend as a support/stop loss on our entry since price should be above it.
Then we just target 1.5x our max loss so that even if we only win 50% of the time, we still make a profit.
The explicit rules of this strategy are as follows:
=== Rules ===
long only
- price above EMA200
short only
- price below EMA200
Stop Loss = 2nd SuperTrend line above (short) or below(long) entry candle
Profit = 1.5x SL/risk (Profit Ratio x Max Loss)
=== Entry Setup ===
LONG
- Stoch RSI below 20, cross up
- at least 2 SuperTrend lines below close
SHORT
- Stoch RSI above 80, cross down
- at least 2 SuperTrend lines above close
P.S. Special thanks to Trade Pro for producing so many quality videos, putting strategy claims to the test, and providing me with so many good ideas I apply to my own strategies.

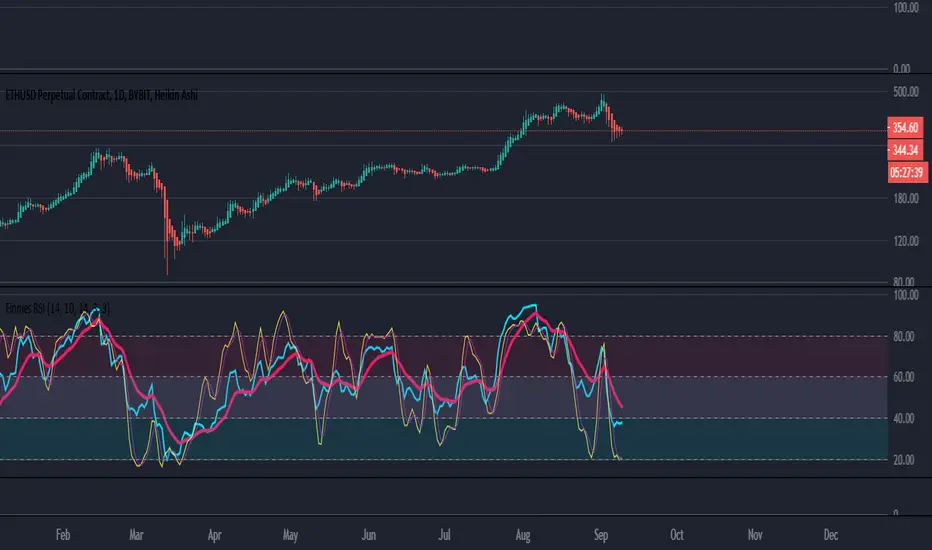
Finnie's RSI with EMA crossover + StochRSI seams to be one of the most used indicators by far, and that comes because of merit. With that in mind, the goal of this indicator is to expand upon the tradition RSI or Relative Strength Index we all know and love :) I started by adding an EMA crossover. Which gives you, the users, a general idea of when to buy and sell outside of just watching a line go down and up. To take thinks even further, I decided to add options for both Fast and Slow Stochastic oscillators. Adding STOCH brings in another variable when deciding on an entry, technically its a bit hard to explain but in practice it would go something like this: you notice RSI is down around the level 20 mark and RSI is crossing up above it's EMA, which is BULLISH signal, and you're thinking about going long. As a second confirmation you can look at the STOCH rsi, if it's also crossing above the previously spoken EMA that's another BULLISH signal. This process can be repeated once RSI has risen to find an exit.
EDIT: If you find the indicator is a bit too cluttered for you, feel free to disable the 'STOCH rsi' feature in settings :)
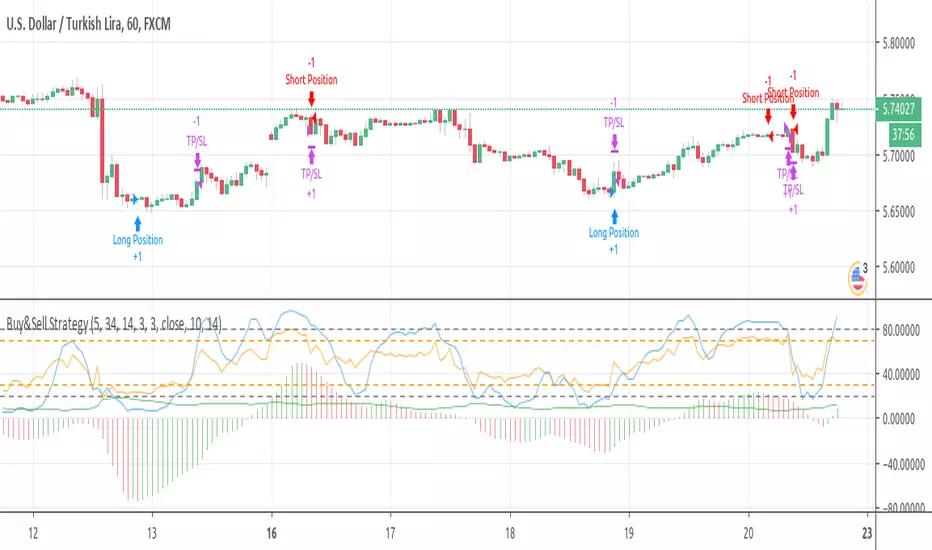
Buy&Sell Strategy depends on AO+Stoch+RSI+ATR by SerdarYILMAZThis strategy is just for training, its purpose is just learning code in pine script.
Don't make buy or sell decision with this strategy.
Turkish/Turkce
Bu strateji sadece pine script'te kodlamanın nasıl yapildigini ogrenmek icindir.
Bu stratejiye dayanarak, kesinlikle al-sat islemleri yapmayin.
How it works?
When RSI and Stoch are in oversold area and if awesome osc. turns positive, take long position. Stop loss and take profit levels were defined with ATR ind.
When RSI and Stoch are in overbought are and if awesome osc. turns negative, take short position. Stop loss and take profit levels were defined with ATR ind.
Turkish/Turkce
RSI ve Stoch asiri satım bölgesinde iken awesome pozitife döner ise long pozisyon açar, zarar kes ve kar al seviyeleri ATR indikatoru ile tanımlandı.
RSI ve Stoch asırı alım bölgesinde iken awesome negatife döner ise short pozisyon açar, zarar kes ve kar al seviyeleri ATR indikatoru ile tanımlandı.
Finnie's RSI with EMA + MFI + Stoch V2RSI seams to be one of the most used indicators by far, and that comes because of merit . With that in mind, the goal of this indicator is to expand upon the tradition RSI or Relative Strength Index we all know and love :) I started by adding an EMA crossover. Which gives you, the users, a general idea of when to buy and sell outside of just watching a line go down and up. To take thinks even further, I decided to add options for both Fast and Slow Stochastic oscillators. Adding STOCH brings in another variable when deciding on an entry, technically its a bit hard to explain but in practice it would go something like this: you notice RSI is down around the level 20 mark and RSI is crossing up above it's EMA , which is BULLISH signal, and you're thinking about going long. As a second confirmation you can look at the STOCH rsi , if it's also crossing above the previously spoken EMA that's another BULLISH signal. This process can be repeated once RSI has risen to find an exit.
V2 changes:
-added MFI
-added overbought(yellow)/oversold(red) visual indicator
-removed K stoch in order to clean the indicator up visually, I haven't regretted it since :)

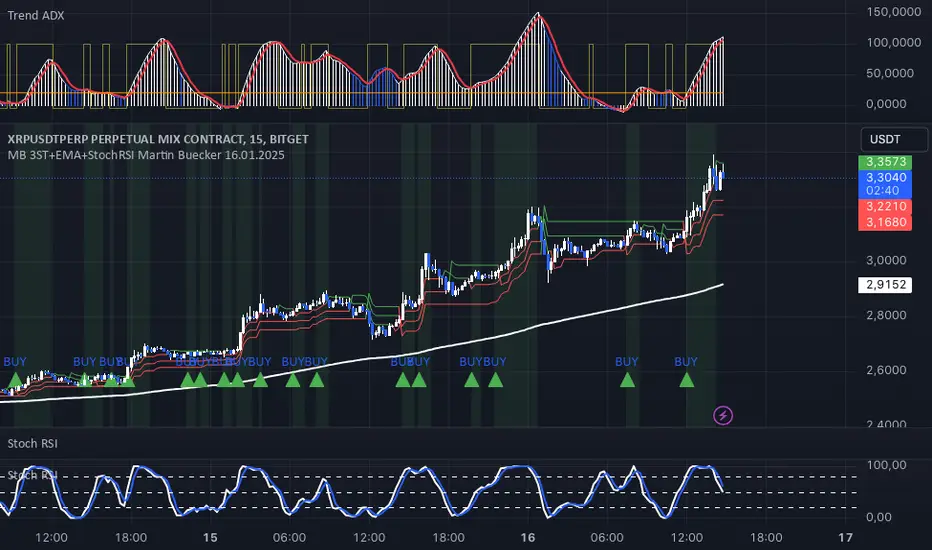
MB 3ST+EMA+StochRSI Martin Buecker 16.01.2025Short Description of the Indicator "MB 3ST+EMA+StochRSI Martin Buecker 16.01.2025"
This trend-following and momentum-based indicator combines Supertrend, EMA 200, and Stochastic RSI to generate buy and sell signals with improved accuracy.
1. Key Components
Supertrend (3 variations):
Uses three Supertrend indicators with different periods to confirm trend direction.
Buy signal when at least 2 Supertrends are bearish.
Sell signal when at least 2 Supertrends are bullish.
EMA 200 (Exponential Moving Average):
Buy signals only when the price is above EMA 200 (uptrend confirmation).
Sell signals only when the price is below EMA 200 (downtrend confirmation).
Multi-Timeframe Stochastic RSI:
Uses a higher timeframe Stoch RSI (default: 15 minutes) to filter signals.
Buy signal when %K crosses above %D (bullish momentum).
Sell signal when %K crosses below %D (bearish momentum).
2. Signal Generation
📈 Buy Signal Conditions:
✅ At least 2 of 3 Supertrends are bearish
✅ Price is above EMA 200
✅ Stoch RSI shows a bullish crossover (%K > %D)
📉 Sell Signal Conditions:
✅ At least 2 of 3 Supertrends are bullish
✅ Price is below EMA 200
✅ Stoch RSI shows a bearish crossover (%K < %D)
3. Visual Representation & Alerts
Supertrend Lines:
Green = Bullish, Red = Bearish
EMA 200: White Line
Buy/Sell Signals:
Green triangle (below bar) = Buy
Red triangle (above bar) = Sell
Alerts:
Notifies users when a buy or sell signal is triggered.
Background Coloring:
Green for Buy signals, Red for Sell signals
4. Purpose & Benefits
🔥 Combines trend (EMA 200, Supertrend) and momentum analysis (Stoch RSI) for better signal accuracy.
🔥 Works best in trending markets, filtering out false signals in sideways movements.
🔥 Suitable for scalping and day trading, providing clear and structured trade entries.
Backtest any Indicator v5Happy Trade,
here you get the opportunity to backtest any of your indicators like a strategy without converting them into a strategy. You can choose to go long or go short and detailed time filters. Further more you can set the take profit and stop loss, initial capital, quantity per trade and set the exchange fees. You get an overall result table and even a detailed, scroll-able table with all trades. In the Image 1 you see the provided info tables about all Trades and the Result Summary. Further more every trade is marked by a background color, Labels and Levels. An opening Label with the trade direction and trade number. A closing Label again with the trade number, the trades profit in % and the total amount of $ after all past trades. A green line for the take profit level and a red line for the stop loss.
Image 1
Example
For this description we choose the Stochastic RSI indicator from TradingView as it is. In Image 2 is shown the performance of it with decent settings.
Timeframe=45, BTCUSD, 2023-08-01 - 2023-10-20
Stoch RSI: k=30, d=40, RSI-length=140, stoch-length=140
Backtest any Indicator: input signal=Stoch RSI, goLong, take profit=9.1%, stop loss=2.5%, start capital=1000$, qty=5%, fee=0.1%, no Session Filter
Image 2
Usage
1) You need to know the name of the boolean (or integer) variable of your indicator which hold the buy condition. Lets say that this boolean variable is called BUY. If this BUY variable is not plotted on the chart you simply add the following code line at the end of your pine script.
For boolean (true/false) BUY variables use this:
plot(BUY ? 1:0,'Your buy condition hold in that variable BUY',display = display.data_window)
And in case your script's BUY variable is an integer or float then use instate the following code line:
plot(BUY ,'Your buy condition hold in that variable BUY',display = display.data_window)
2) Probably the name of this BUY variable in your indicator is not BUY. Simply replace in the code line above the BUY with the name of your script's trade condition variable.
3) Save your changed Indicator script.
4) Then add this 'Backtest any Indicator' script to the chart ...
5) and go to the settings of it. Choose under "Settings -> Buy Signal" your Indicator. So in the example above choose .
The form is usually: ' : BUY'. Then you see something like Image 2
6) Decide which trade direction the BUY signal should trigger. A go Long or a go Short by set the hook or not.
Now you have a backtest of your Indicator without converting it into a strategy. You may change the setting of your Indicator to the best results and setup the following strategy settings like Time- and Session Filter, Stop Loss, Take Profit etc. More of it below in the section Settings Menu.
Appereance
In the Image 2 you see on the right side the List of Trades . To scroll down you go into the settings again and decrease the scroll value. So you can see all trades that have happened before. In case there is an open trade you will find it at the last position of the list.
Every Long trade is green back grounded while Short trades are red.
Every trade begins with a label that show goLong or goShort and its number. And ends with another label again with its number, Profit in % and the resulting total amount of cash.
If activated you further see the Take Profit as a green line and the Stop Loss as a orange line. In the settings you can set their percentage above or below the entry price.
You also see the Result Summary below. Here you find the usual stats of a strategy of all closed trades. The profit after total amount of fees , amount of trades, Profit Factor and the total amount of fees .
Settings Menu
In the settings menu you will find the following high-lighted sections. Most of the settings have a question mark on their right side. Move over it with the cursor to read specific explanation.
Input Signal of your Indicator: Under Buy you set the trade signal of your Indicator. And under Target you set the value when a trade should happen. In the Example with the Stochastic RSI above we used 20. Below you can set the trade direction, let it be go short when hooked or go long when unhooked.
Trade Settings & List of Trades: Take Profit set the target price of any trade. Stop Loss set the price to step out when a trade goes the wrong direction. Check mark the List of Trades to see any single trade with their stats. In case that there are more trades as fits in the list you can scroll down the list by decrease the value Scroll .
Time Filter: You can set a Start Time or deactivate it by leave it unhooked. The same with End Time .
Session Filter: here you can choose to activate it on weekly base. Which days of the week should be trading and those without. And also on daily base from which time on and until trade are possible. Outside of all times and sessions there will be no new trades if activated.
Invest Settings: here you can choose the amount of cash to start with. The Quantity percentage define for every trade how much of the cash should be invested and the Fee percentage which have to be payed every trade. Open position and closing position.
Other Announcements
This Backtest script don't use the strategy functions of TradingView. It is programmed as an indicator. All trades get executed at candle closing. This script use the functionality "Indicator-on-Indicator" from TradingView.
Conclusion
So now it is your turn, take your promising indicators and connect it to that Backtest script. With it you get a fast impression of how successful your indicator will trade. You don't have to relay on coders who maybe add cheating code lines. Further more you can check with the Time Filter under which market condition you indicator perform the best or not so well. Also with the Session Filter you can sort out repeating good market conditions for your indicator. Even you can check with the GoShort XOR GoLong check mark the trade signals of you indicator in opposite trade direction with one click. And compare your indicators under the same conditions and get the results just after 2 clicks. Thanks to the in-build fee setting you get an impression how much a 0.1% fee cost you in total.
Cheers

MTF Fantastic Stochastic (FS+)MTF Fantastic Stochastic (FS+) + Alerts
This chart overlay indicator can signal multiple triple-timeframe Stochastic RSI overbought and oversold confluences directly onto your chart, intended for use as a confluence either for reversal trade entries, or potential trade exits, indicating where price may be probable to reverse.
Features include:
- Primary set of fully configurable triple-timeframe overbought and oversold signals, indicating where 3 selected timeframes are all overbought or all oversold at the same time. Enabled by default.
- Secondary set of fully configurable triple-timeframe overbought and oversold signals, indicating where 3 selected timeframes are all overbought or all oversold at the same time, with alert option. Enabled by default.
- Also includes standard configurable Stoch RSI options, including k length, d length, RSI length, Stochastic length, etc.
- The default primary MTF #1 timeframes are set to 1minute, 5minute and 15minute. These are highly suitable for low timeframe scalpers trading on charts less than 5 minutes, and can often pin point price reversals.
- The default Secondary MTF #2 timeframes are set to 15minute, 30minute and 60minute. These are suitable for both low timeframe scalpers and considerably higher timeframe traders.
- Optional drawing of background colours and/or ribbon seen at bottom of the chart.
- Fully configurable timeframes, as well as overbought and oversold threshold levels for each individual timeframe. Overbought and oversold thresholds are set to the factory 80 and 20 levels respectively for all timeframes by default.
- Alert features for both MTF #1 and MTF #2 triple-timeframe confluences, including options for alerting overbought and oversold individually, as well as an option for alerting either overbought or oversold in a single alert.
Note: THe features listed above are accurate at the time of publishing but maybe updated or added to in future.
The Stochastic RSI
The popular oscillator has been described as follows:
“The Stochastic RSI is an indicator used in technical analysis that ranges between zero and one (or zero and 100 on some charting platforms) and is created by applying the Stochastic oscillator formula to a set of relative strength index ( RSI ) values rather than to standard price data. Using RSI values within the Stochastic formula gives traders an idea of whether the current RSI value is overbought or oversold. The Stochastic RSI oscillator was developed to take advantage of both momentum indicators in order to create a more sensitive indicator that is attuned to a specific security's historical performance rather than a generalized analysis of price change.”
How do traders use overbought and oversold levels in their trading?
The oversold level, that is when the Stochastic RSI is above the 80 level is typically interpreted as being 'overbought', and below the 20 level is typically considered 'oversold'. Traders will often use the Stochastic RSI at an overbought level as a confluence for entry into a short position, and the Stochastic RSI at an oversold level as a confluence for an entry into a long position. These levels do not mean that price will necessarily reverse at those levels in a reliable way, however. This is why this version of the Stoch RSI employs the triple timeframe overbought and oversold confluence, in an attempt to add a more confluence and reliability to this usage of the Stoch RSI.
This indicator was originally built as one of a many features included in the RF+ Divergence Scalping System and has been separated into it's own standalone indicator here for traders who do not want the many other features bundled into the original indicator. A number of features that exist in the original were intensive, and also quite niche. Therefore this lightweight single purpose chart overlay indicator offers this versatile feature of the ever popular Stochastic RSI to a wider audience of traders who may add it to various strategies.

pandas_taLibrary "pandas_ta"
Level: 3
Background
Today is the first day of 2022 and happy new year every tradingviewers! May health and wealth go along with you all the time. I use this chance to publish my 1st PINE v5 lib : pandas_ta
This is not a piece of cake like thing, which cost me a lot of time and efforts to build this lib. Beyond 300 versions of this script was iterated in draft.
Function
Library "pandas_ta"
PINE v5 Counterpart of Pandas TA - A Technical Analysis Library in Python 3 at github.com
The Original Pandas Technical Analysis (Pandas TA) is an easy to use library that leverages the Pandas package with more than 130 Indicators and Utility functions and more than 60 TA Lib Candlestick Patterns.
I realized most of indicators except Candlestick Patterns because tradingview built-in Candlestick Patterns are even more powerful!
I use this to verify pandas_ta python version indicators for myself, but I realize that maybe many may need similar lib for pine v5 as well.
Function Brief Descriptions (Pls find details in script comments)
bton --> Binary to number
wcp --> Weighted Closing Price (WCP)
counter --> Condition counter
xbt --> Between
ebsw --> Even Better SineWave (EBSW)
ao --> Awesome Oscillator (AO)
apo --> Absolute Price Oscillator (APO)
xrf --> Dynamic shifted values
bias --> Bias (BIAS)
bop --> Balance of Power (BOP)
brar --> BRAR (BRAR)
cci --> Commodity Channel Index (CCI)
cfo --> Chande Forcast Oscillator (CFO)
cg --> Center of Gravity (CG)
cmo --> Chande Momentum Oscillator (CMO)
coppock --> Coppock Curve (COPC)
cti --> Correlation Trend Indicator (CTI)
dmi --> Directional Movement Index(DMI)
er --> Efficiency Ratio (ER)
eri --> Elder Ray Index (ERI)
fisher --> Fisher Transform (FISHT)
inertia --> Inertia (INERTIA)
kdj --> KDJ (KDJ)
kst --> 'Know Sure Thing' (KST)
macd --> Moving Average Convergence Divergence (MACD)
mom --> Momentum (MOM)
pgo --> Pretty Good Oscillator (PGO)
ppo --> Percentage Price Oscillator (PPO)
psl --> Psychological Line (PSL)
pvo --> Percentage Volume Oscillator (PVO)
qqe --> Quantitative Qualitative Estimation (QQE)
roc --> Rate of Change (ROC)
rsi --> Relative Strength Index (RSI)
rsx --> Relative Strength Xtra (rsx)
rvgi --> Relative Vigor Index (RVGI)
slope --> Slope
smi --> SMI Ergodic Indicator (SMI)
sqz* --> Squeeze (SQZ) * NOTE: code sufferred from very strange error, code was commented.
sqz_pro --> Squeeze PRO(SQZPRO)
xfl --> Condition filter
stc --> Schaff Trend Cycle (STC)
stoch --> Stochastic (STOCH)
stochrsi --> Stochastic RSI (STOCH RSI)
trix --> Trix (TRIX)
tsi --> True Strength Index (TSI)
uo --> Ultimate Oscillator (UO)
willr --> William's Percent R (WILLR)
alma --> Arnaud Legoux Moving Average (ALMA)
xll --> Dynamic rolling lowest values
dema --> Double Exponential Moving Average (DEMA)
ema --> Exponential Moving Average (EMA)
fwma --> Fibonacci's Weighted Moving Average (FWMA)
hilo --> Gann HiLo Activator(HiLo)
hma --> Hull Moving Average (HMA)
hwma --> HWMA (Holt-Winter Moving Average)
ichimoku --> Ichimoku Kinkō Hyō (ichimoku)
jma --> Jurik Moving Average Average (JMA)
kama --> Kaufman's Adaptive Moving Average (KAMA)
linreg --> Linear Regression Moving Average (linreg)
mgcd --> McGinley Dynamic Indicator
rma --> wildeR's Moving Average (RMA)
sinwma --> Sine Weighted Moving Average (SWMA)
ssf --> Ehler's Super Smoother Filter (SSF) © 2013
supertrend --> Supertrend (supertrend)
xsa --> X simple moving average
swma --> Symmetric Weighted Moving Average (SWMA)
t3 --> Tim Tillson's T3 Moving Average (T3)
tema --> Triple Exponential Moving Average (TEMA)
trima --> Triangular Moving Average (TRIMA)
vidya --> Variable Index Dynamic Average (VIDYA)
vwap --> Volume Weighted Average Price (VWAP)
vwma --> Volume Weighted Moving Average (VWMA)
wma --> Weighted Moving Average (WMA)
zlma --> Zero Lag Moving Average (ZLMA)
entropy --> Entropy (ENTP)
kurtosis --> Rolling Kurtosis
skew --> Rolling Skew
xev --> Condition all
zscore --> Rolling Z Score
adx --> Average Directional Movement (ADX)
aroon --> Aroon & Aroon Oscillator (AROON)
chop --> Choppiness Index (CHOP)
xex --> Condition any
cksp --> Chande Kroll Stop (CKSP)
dpo --> Detrend Price Oscillator (DPO)
long_run --> Long Run
psar --> Parabolic Stop and Reverse (psar)
short_run --> Short Run
vhf --> Vertical Horizontal Filter (VHF)
vortex --> Vortex
accbands --> Acceleration Bands (ACCBANDS)
atr --> Average True Range (ATR)
bbands --> Bollinger Bands (BBANDS)
donchian --> Donchian Channels (DC)
kc --> Keltner Channels (KC)
massi --> Mass Index (MASSI)
natr --> Normalized Average True Range (NATR)
pdist --> Price Distance (PDIST)
rvi --> Relative Volatility Index (RVI)
thermo --> Elders Thermometer (THERMO)
ui --> Ulcer Index (UI)
ad --> Accumulation/Distribution (AD)
cmf --> Chaikin Money Flow (CMF)
efi --> Elder's Force Index (EFI)
ecm --> Ease of Movement (EOM)
kvo --> Klinger Volume Oscillator (KVO)
mfi --> Money Flow Index (MFI)
nvi --> Negative Volume Index (NVI)
obv --> On Balance Volume (OBV)
pvi --> Positive Volume Index (PVI)
dvdi --> Dual Volume Divergence Index (DVDI)
xhh --> Dynamic rolling highest values
pvt --> Price-Volume Trend (PVT)
Remarks
I also incorporated func descriptions and func test script in commented mode, you can test the functino with the embedded test script and modify them as you wish.
This is a Level 3 free and open source indicator library.
Feedbacks are appreciated.
This is not the end of pandas_ta lib publication, but it is start point with pine v5 lib function and I will add more and more funcs into this lib for my own indicators.
Function Name List:
bton()
wcp()
count()
xbt()
ebsw()
ao()
apo()
xrf()
bias()
bop()
brar()
cci()
cfo()
cg()
cmo()
coppock()
cti()
dmi()
er()
eri()
fisher()
inertia()
kdj()
kst()
macd()
mom()
pgo()
ppo()
psl()
pvo()
qqe()
roc()
rsi()
rsx()
rvgi()
slope()
smi()
sqz_pro()
xfl()
stc()
stoch()
stochrsi()
trix()
tsi()
uo()
willr()
alma()
wcx()
xll()
dema()
ema()
fwma()
hilo()
hma()
hwma()
ichimoku()
jma()
kama()
linreg()
mgcd()
rma()
sinwma()
ssf()
supertrend()
xsa()
swma()
t3()
tema()
trima()
vidya()
vwap()
vwma()
wma()
zlma()
entropy()
kurtosis()
skew()
xev()
zscore()
adx()
aroon()
chop()
xex()
cksp()
dpo()
long_run()
psar()
short_run()
vhf()
vortex()
accbands()
atr()
bbands()
donchian()
kc()
massi()
natr()
pdist()
rvi()
thermo()
ui()
ad()
cmf()
efi()
ecm()
kvo()
mfi()
nvi()
obv()
pvi()
dvdi()
xhh()
pvt()

Stochastic RSI with Alerts# Stochastic RSI with Alerts - User Manual
## 1. Overview
This enhanced Stochastic RSI indicator identifies overbought/oversold conditions with visual signals and customizable alerts. It features:
- Dual-line Stoch RSI (K & D)
- Threshold-based buy/sell signals
- Configurable alert system
- Customizable parameters
## 2. Installation
1. Open TradingView chart
2. Open Pine Editor (📈 icon at bottom)
3. Copy/paste the full code
4. Click "Add to Chart"
## 3. Input Parameters
### 3.1 Core Settings
| Parameter | Default | Description |
|-----------|---------|-------------|
| K | 3 | Smoothing period for %K line |
| D | 3 | Smoothing period for %D line |
| RSI Length | 14 | RSI calculation period |
| Stochastic Length | 14 | Lookback period for Stoch calculation |
| RSI Source | Close | Price source for RSI calculation |
### 3.2 Signal Thresholds
| Parameter | Default | Description |
|-----------|---------|-------------|
| Upper Limit | 80 | Sell signal threshold (overbought) |
| Lower Limit | 20 | Buy signal threshold (oversold) |
### 3.3 Alert Settings
| Parameter | Default | Description |
|-----------|---------|-------------|
| Enable Buy Alerts | True | Toggle buy notifications |
| Enable Sell Alerts | True | Toggle sell notifications |
| Custom Alert Message | Empty | Additional text for alerts |
## 4. Signal Logic
### 4.1 Buy Signal (Green ▲)
Triggers when:
\text{%K crossover %D} \quad AND \quad (\text{%K ≤ Lower Limit} \quad OR \quad \text{%D ≤ Lower Limit})
### 4.2 Sell Signal (Red ▼)
Triggers when:
\text{%K crossunder %D} \quad AND \quad (\text{%K ≥ Upper Limit} \quad OR \quad \text{%D ≥ Upper Limit})
## 5. Alert System
### 5.1 Auto-Generated Alerts
The script automatically creates these alert conditions:
- **Buy Signal Alert**: Triggers on valid buy signals
- **Sell Signal Alert**: Triggers on valid sell signals
Alert messages include:
- Signal type (Buy/Sell)
- Current %K and %D values
- Custom message (if configured)
### 5.2 Alert Configuration
**Method 1: Script-Generated Alerts**
1. Hover over any signal marker
2. Click the 🔔 icon
3. Select trigger conditions:
- "Buy Signal Alert"
- "Sell Signal Alert"
**Method 2: Manual Setup**
1. Open Alert creation window
2. Condition: Select "Stoch RSI Alerts"
3. Choose:
- "Buy Signal Alert" for long entries
- "Sell Signal Alert" for exits/shorts
## 6. Customization Tips
### 6.1 Threshold Adjustment
// For day trading (tighter ranges)
upperLimit = 75
lowerLimit = 25
// For swing trading (wider ranges)
upperLimit = 85
lowerLimit = 15
### 6.2 Visual Modifications
Change signal markers via:
- `style=` : Try `shape.labelup`, `shape.flag`, etc.
- `color=` : Use hex codes (#FF00FF) or named colors
- `size=` : `size.tiny` to `size.huge`
## 7. Recommended Use Cases
1. **Mean Reversion Strategies**: Pair with support/resistance levels
2. **Trend Confirmation**: Filter with 200EMA direction
3. **Divergence Trading**: Compare with price action
## 8. Limitations
- Works best in ranging markets
- Combine with volume analysis for confirmation
- Not recommended as standalone strategy
---
This documentation follows technical writing best practices with:
- Clear parameter tables
- Mathematical signal logic
- Visual hierarchy
- Practical examples
- Usage recommendations

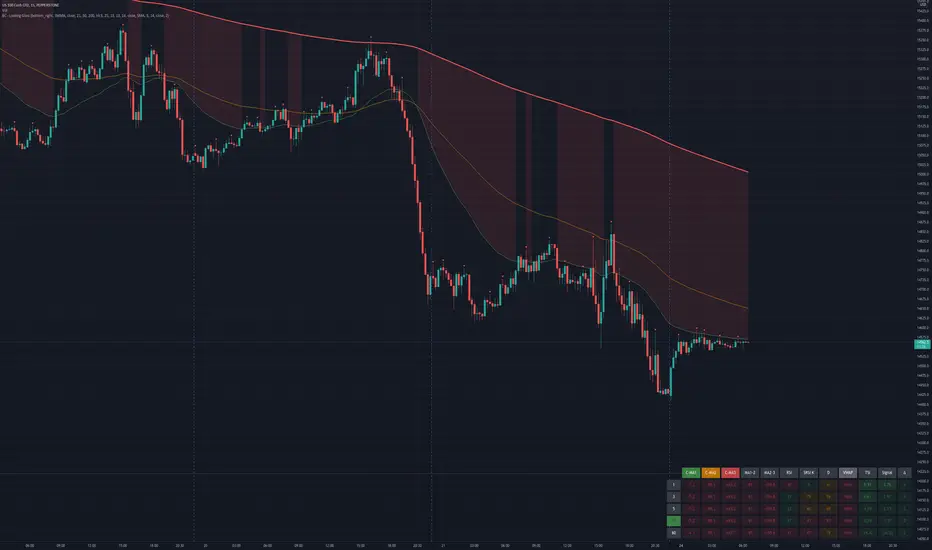
Bogdan Ciocoiu - Looking Glass► Description
The script shows a multi-timeline suite of information for the current ticker. This information refers to configurable moving averages, RSI, Stochastic RSI, VWAP and TSI data. The timeframes reflected in the script vary from 1m to 1h. I recommend the tool for 3m scalping as it provides good visibility upwards.
The headings from the table are:
{Close} - {MA1}
{Close} - {MA2}
{Close} - {MA3}
{MA1} - {MA2}
{MA2} - {MA3}
{RSI}
{Stoch RSI K}
{Stoch RSI D}
{VWAP}
{TSI}
{TSI EMA}
{TSI} - {TSI EMA}
► Originality and usefulness
This tool is helpful because it helps users read a chart much quicker than if they were to navigate between timeframes. The colour coding indicates an accident/descendant trend between any two values (i.e. close vs MA1, MA1-MA2, RSI K vs RSI D, etc.).
► Open-source reuse
www.tradingview.com
www.tradingview.com
www.tradingview.com
www.tradingview.com
www.tradingview.com
MTF Oscillator Stack [BigBeluga]🔵 OVERVIEW
The MTF Oscillator Stack brings powerful multi-timeframe momentum analysis directly into your price chart. You can select one oscillator— RSI , MFI , or Stochastic RSI —and display it across up to 4 different timeframes. Each panel is neatly stacked horizontally above price , offering quick insight into cross-timeframe conditions like trend direction, exhaustion zones, and momentum shifts.
🔵 CONCEPTS
Single Oscillator Mode: Select one oscillator type (RSI, MFI, or Stoch RSI) to analyze across all selected timeframes.
Top-Chart Horizontal Panels: Oscillator plots are aligned horizontally at the top of the chart for seamless top-down reading.
Signal Comparison Arrows: Arrows (🢁 / 🢃) indicate oscillator position relative to its signal line.
Overbought/Oversold Zones: Transparent 30–70 fill zones highlight key reversal areas.
Dynamic Display Logic: Only enabled panels are shown; spacing adjusts based on active timeframes.
Timeframe Tagging: Each oscillator panel is labeled with its corresponding timeframe (e.g., 1H, 2H, 4H).
🔵 FEATURES
Choose one oscillator (RSI, MFI, or Stoch RSI) and apply it across up to 4 timeframes.
Each oscillator panel includes: price-synced plot, signal line, and zone shading.
Scale alignment allows users to place charts at the bottom or top.
Clear arrow signals show whether oscillator is bullish or bearish.
Individual length and signal settings per timeframe.
Toggle for alignment mode: evenly spaced or floating layout.
All panels use a consistent layout for faster decision-making.
🔵 HOW TO USE
Select your preferred oscillator and activate 2–4 key timeframes (e.g., 1H, 4H, D1, W1).
Use signal crossovers as a bullish (🢁) or bearish (🢃) trend cue.
Look for aligned extremes (e.g., all timeframes overbought) to spot momentum exhaustion.
Ideal for momentum confluence strategies and top-down confirmation.
Use horizontal layout to stay focused on price while assessing broader structure.
🔵 CONCLUSION
MTF Oscillator Stack simplifies complex multi-timeframe momentum analysis into one clean, actionable visual. Whether you're tracking RSI, MFI, or Stoch RSI, this tool helps you stay aligned with the broader trend—without ever leaving your main chart.

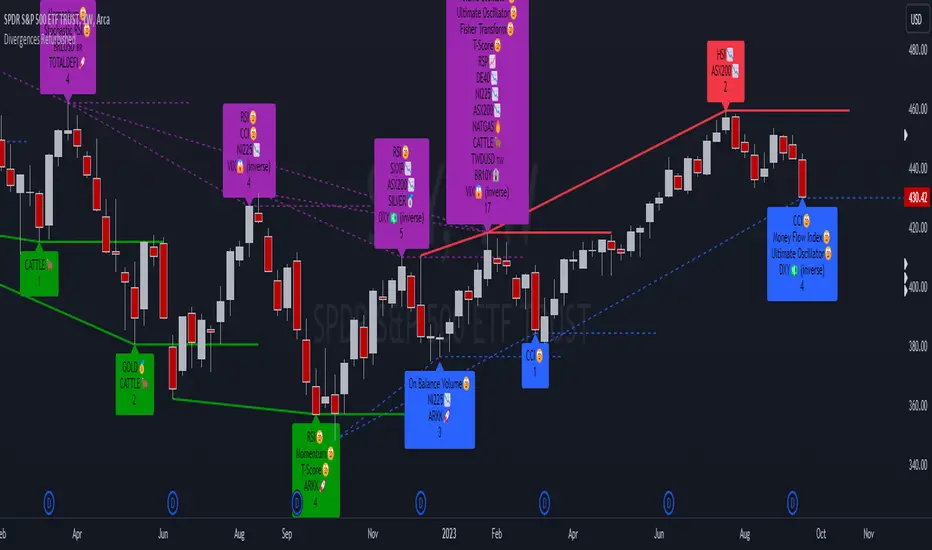
Divergences RefurbishedJust as "a butterfly can flap its wings over a flower in China and cause a hurricane in the Caribbean" (Edward Lorenz), small divergences in markets can signal big trading opportunities.
█Introduction
This is a script forked from LonesomeTheBlue's Divergence for Many Indicators v4.
It is a script that checks for divergence between price and many indicators.
In this version, I added more indicators and also added 40 symbols to check for divergences.
More info on the original script can be found here:
█ Improvements
The following improvements have been implemented over v4:
1. Added parameters to customize indicators.
2. Added new indicators:
- Stoch RSI
- Volume Oscillator
- PVT (Price Volume Trend)
- Ultimate Oscillator
- Fisher Transform
- Z-Score/T-Score
3. Now there is the possibility of using 2 external indicators.
4. New option to show tooltips inside labels.
This allows you to save space on the screen if you choose the option to only show the number of divergences or just the abbreviations.
5. New option to show additional text next to the indicator name.
This allows for grouping of indicators and symbols and better visualization, whether through emojis, for example.
6. Added 40 customizable symbols to check for divergences.
7. Option "show only the first letter" of the indicator replaced by: "show the abbreviation of the indicator".
Reason: the indicator abbreviation is more informative and easier to read.
8. Script converted to PineScript version 5.
█ CONCEPTS
Below I present a brief description of the available indicators.
1. Moving Average Convergence/Divergence (MACD):
Shows the difference between short-term and long-term exponential moving averages.
2. MACD Histogram:
Shows the difference between MACD and its signal line.
3. Relative Strength Index (RSI):
Measures the relative strength of recent price gains to recent price losses of an asset.
4. Stochastic Oscillator (Stoch):
Compares the current price of an asset to its price range over a specified time period.
5. Stoch RSI:
Stochastic of RSI.
6. Commodity Channel Index (CCI):
Measures the relationship between an asset's current price and its moving average.
7. Momentum: Shows the difference between the current price and the price a few periods ago.
Shows the difference between the current price and the price of a certain period in the past.
8. Chaikin Money Flow (CMF):
A variation of A/D that takes into account the daily price variation and weighs trading volume accordingly. Accumulation/Distribution (A/D) identifies buying and selling pressure by tracking the flow of money into and out of an asset based on volume patterns.
9. On-Balance Volume (OBV):
Identify divergences between trading volume and an asset's price.
Sum of trading volume when the price rises and subtracts volume when the price falls.
10. Money Flow Index (MFI):
Measures volume pressure in a range of 0 to 100.
Calculates the ratio of volume when the price goes up and when the price goes down.
11. Volume Oscillator (VO):
Identify divergences between trading volume and an asset's price. Ratio of change of volume, from a fast period in relation to a long period.
12. Price-Volume Trend (PVT):
Identify the strength of an asset's price trend based on its trading volume. Cumulative change in price with volume factor. The PVT calculation is similar to the OBV calculation, but it takes into account the percentage price change multiplied by the current volume, plus the previous PVT value.
13. Ultimate Oscillator (UO):
Combines three different time periods to help identify possible reversal points.
14. Fisher Transform (FT):
Normalize prices into a Gaussian normal distribution.
15. Z-Score/T-Score: Shows the difference between the current price and the price a few periods ago. I is a statistical measurement that indicates how many standard deviations a data point is from the mean of a data set.
When to use t-score instead of z-score? When the sample size is small (length < 30).
Here, the use of z-score or t-score is chosen automatically based on the length parameter.
█ What to look for
The operation is simple. The script checks for divergences between the price and the selected indicators.
Now with the possibility of using multiple symbols, it is possible to check divergences between different assets.
A well-described view on divergences can be found in this cheat sheet:
◈ Examples with SPY ETF versus indicators:
1. Regular bullish divergence with external indicator:
1. Regular bearish divergence with Fisher Transform:
1. Positive hidden divergence with Momentum indicator:
1. Negative hidden divergence with RSI:
◈ Examples with SPY ETF versus other symbols:
1. Regular bearish divergence with European Stoch Market:
2. Regular bearish divergence with DXY inverted:
3. Regular bullish divergence with Taiwan Dollar:
4. Regular bearish divergence with US10Y (10-Year US Treasury Note):
5. Regular bullish divergence with QQQ ETF (Nasdaq 100):
6. Regular bullish divergence with ARKK ETF (ARK Innovation):
7.Positive hidden divergence with RSP ETF (S&P 500 Equal Weight):
8. Negative hidden divergence with EWZ ETF (Brazil):
◈ Examples with BTCUSD versus other symbols:
1. Regular bearish divergence with BTCUSDLONGS from Bitfinex:
2. Regular bearish divergence with BLOK ETF (Amplify Transformational Data Sharing):
3. Negative hidden divergence with NATGAS (Natural Gas):
4. Positive hidden divergence with TOTALDEFI (Total DeFi Market Cap):
█ Conclusion
The symbols available to check divergences were chosen in such a way as to cover the main markets, in the most generic way possible.
You can adjust them according to your needs.
A trader in the American market, for example, could add more ETFs, American stocks, and sectoral indices, such as the XLF (Financial Select Sector SPDR Fund), the XLK (Technology Select Sector SPDR), etc.
On the other hand, a cryptocurrency trader could add more currency pairs and sector indicators, such as BTCUSDSHORTS (Bitfinex), USDT.D (Tether Dominance), etc.
If the chart becomes too cluttered, you can use the option to show only the number of divergences or only the indicator abbreviations.
Or even disable certain indicators and symbols, if they are not of interest to you.
I hope this script is useful.
Don't forget to support LonesomeTheBlue's work too.
Stoch_RSI_ChartEnhanced Stochastic RSI Divergence Indicator with VWAP Filter for Charts
This custom indicator builds upon the classic Stochastic RSI to automatically detect both regular and hidden divergences. It’s designed to help traders spot potential market reversals or continuations using two methods for divergence detection (fractal‑ and pivot‑based) while offering optional VWAP filtering for confirmation.
Key Features
Stoch RSI Calculation
The indicator computes a smoothed Stoch RSI using configurable parameters for RSI length, stochastic length, and smoothing periods. An option to average the K and D lines provides a cleaner momentum view.
Divergence Detection via Fractals & Pivots
Fractal-Based Divergences:
Looks for 4-candle patterns to identify higher-highs or lower-lows in the price that are not confirmed by the oscillator, signaling potential reversals.
Pivot-Based Divergences:
Utilizes TradingView’s built-in pivot functions to find divergence conditions over adjustable pivot ranges.
Regular vs. Hidden Divergences:
Regular Divergence: Occurs when price makes a new extreme (higher high or lower low) while the Stoch RSI fails to follow suit.
Hidden Divergence: Indicates potential trend continuations when the oscillator diverges against the established price trend.
Optional VWAP Filtering
The script includes two optional VWAP filters that work as follows:
VWAP Filter on Regular Divergences:
Only confirms regular divergence signals if the current price satisfies the VWAP condition (e.g., price is above VWAP for bullish signals, below VWAP for bearish signals).
VWAP Filter on Hidden Divergences:
Similarly, hidden divergence signals are validated only when the price meets specific VWAP conditions, adding an extra layer of trend confirmation.
Customizable Alerts and Visual Labels
Easily configure divergence labels (“B” for bullish, “S” for bearish) and enable up to four alert conditions for real‑time notifications when a divergence occurs.
Credits & History:
Log RSI by @fskrypt
Divergence Detection originally by @RicardoSantos (with edits from @JustUncleL)
Further Edits by @NeoButane on August 8, 2018
Latest Edits by @FYMD on June 1, 2024

ReversalCandlestickPatternWithTrendIndentifierGMLibrary "ReversalCandlestickPatternWithTrendIndentifierGM"
Provides functions calculating the all-time high/low of values.
reversalCandlestickPatternWithTrendIndentifier(bullishcriteria, bearishcriteria, momentumOscillatorTypeInput) Calculates the Reversal Candlestick Pattern With Trend Indentifier.
Parameters:
bullishcriteria : Stoch RSI/RSI Bullish Criteria. defval=70, minval=60, maxval=100
bearishcriteria : Stoch RSI/RSI Bearish Criteria. defval=30, minval=0, maxval=40
momentumOscillatorTypeInput : Momentum Oscillator Type. options=
Returns: Reversal Candlestick Pattern With Trend Indentifier.

RSI2 with alerts by Mr.TuanDoan for Binary OptionIdea was developed from Larry Connors RSI2.
The 2-period RSI strategy is a fairly simple mean-reversion trading strategy designed to buy or sell securities after a corrective period.
You should look for buying opportunities when 2-period RSI moves below Lower Band (5), which is considered deeply oversold. Conversely, you can look for short-selling opportunities when 2-period RSI moves above Upper Band (95).
This is a rather aggressive short-term strategy for Binary Option.
Best use with Stoch RSI x 2.
The settings for Stoch RSI are
- Slow: 3 3 14 14
- Fast: 3 3 5 5
Only consider a PUT/CALL when both Stoch RSI are in the same state (overbought/oversold).
When arrow appears on the candle, it likely reverse the current trend.
Note
This is not a holy-grail.
Please follow your risk management
Confirmations must be met before entering a trade
It's for Binary Option
